Built for
- Engineers with a high quality bar, on one product or several
- Products with a lifecycle measured in years, not sprints
- A team of one that works like a team of ten
beacon platform · for professional engineers
For professional software engineers who hold their products to a high bar, whether that's one product or a whole product portfolio. Agents do the work, specs and tests keep it honest, and every decision is still there when you come back six months later.
Who this is for
Built for
Not built for
If the code only has to work today, you don't need us.
See it run
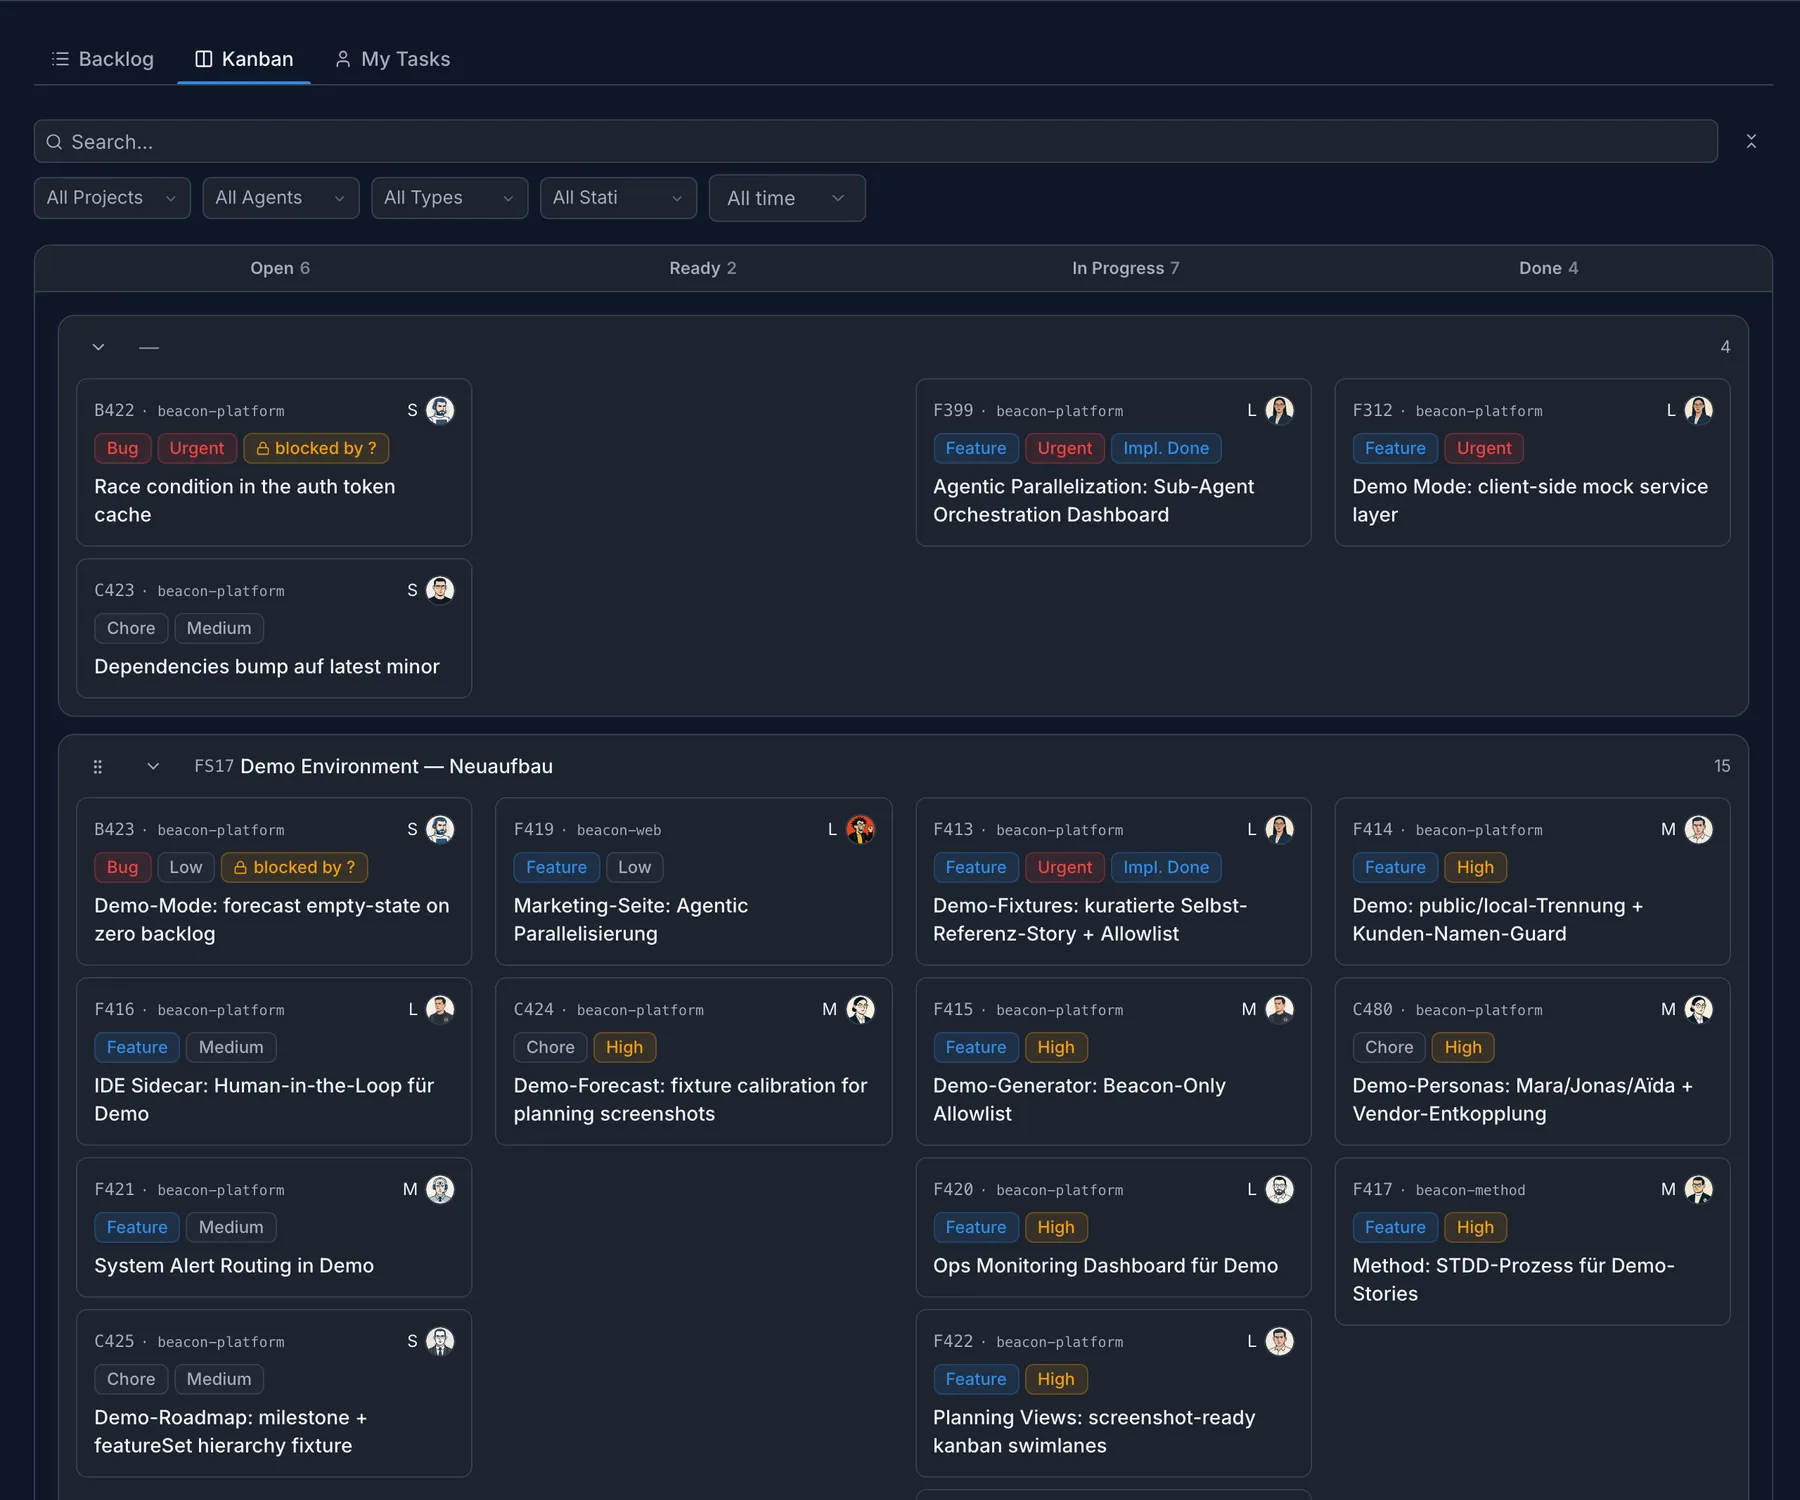
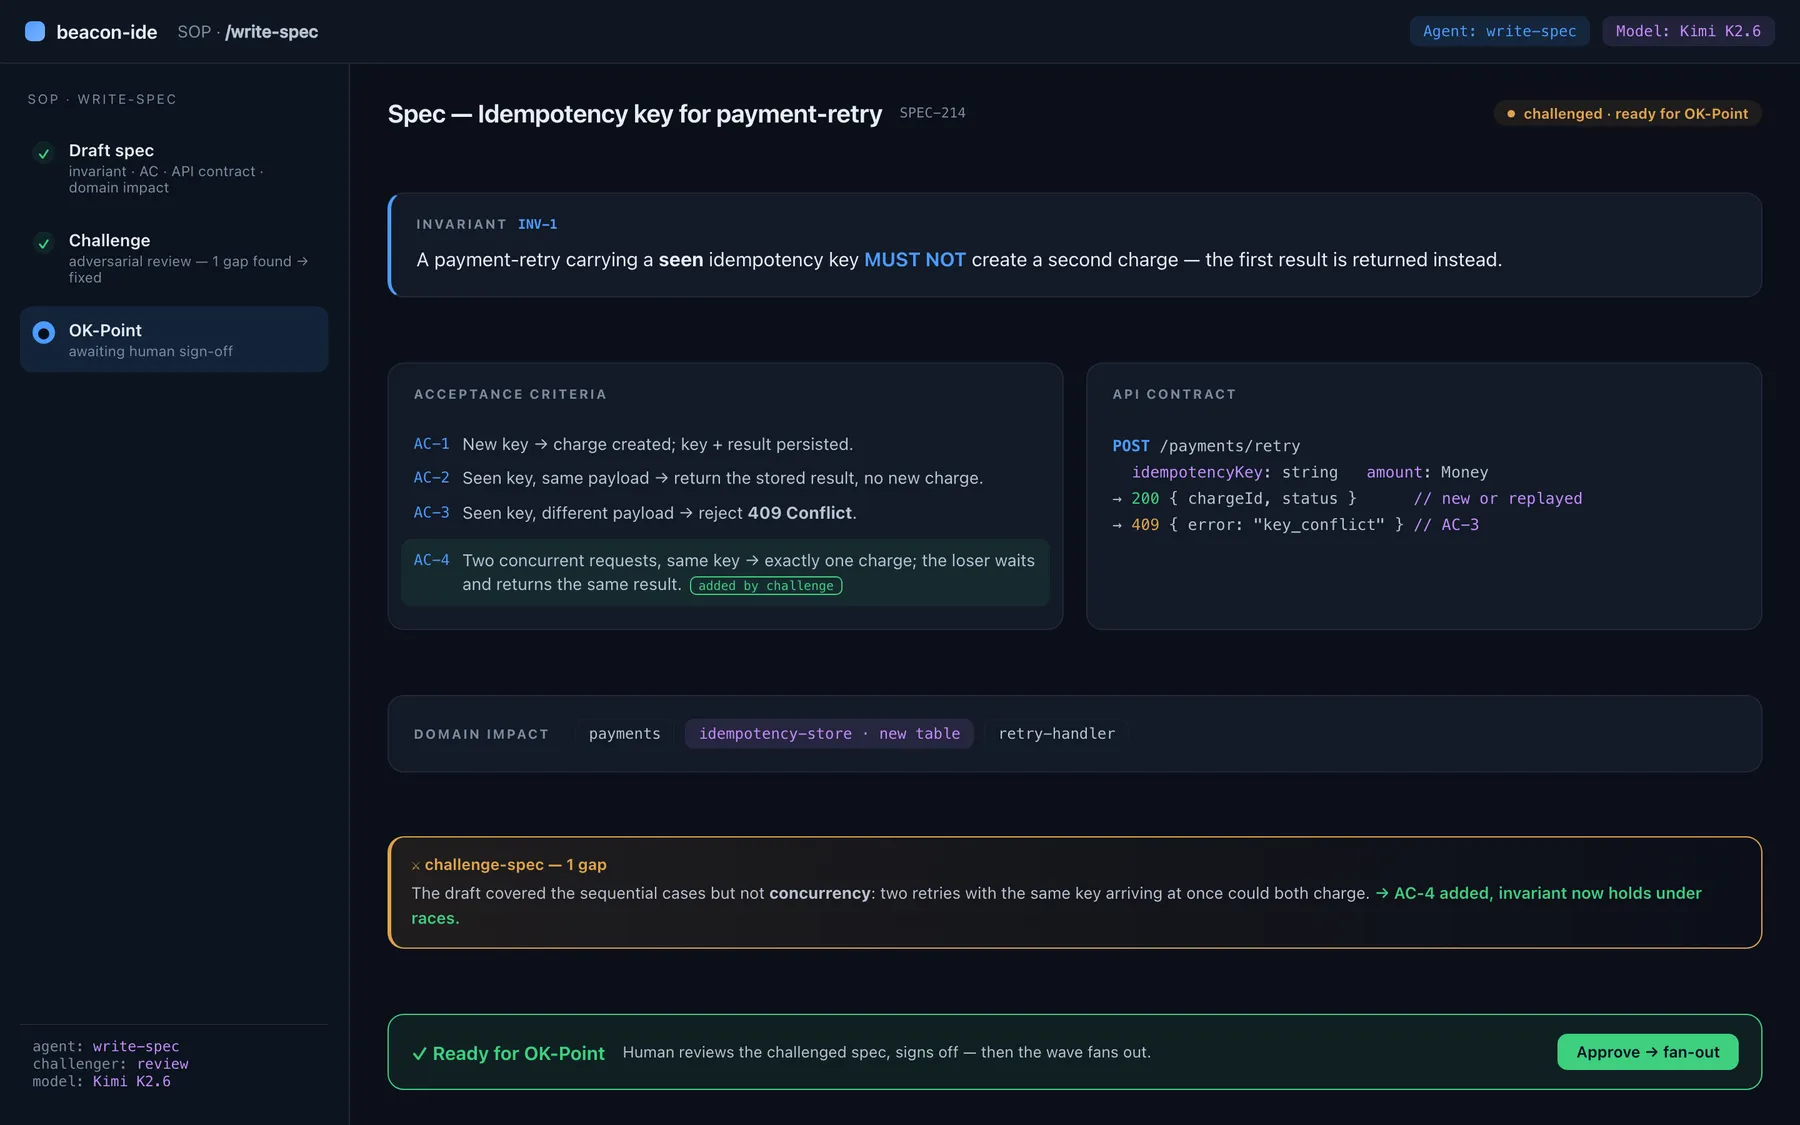
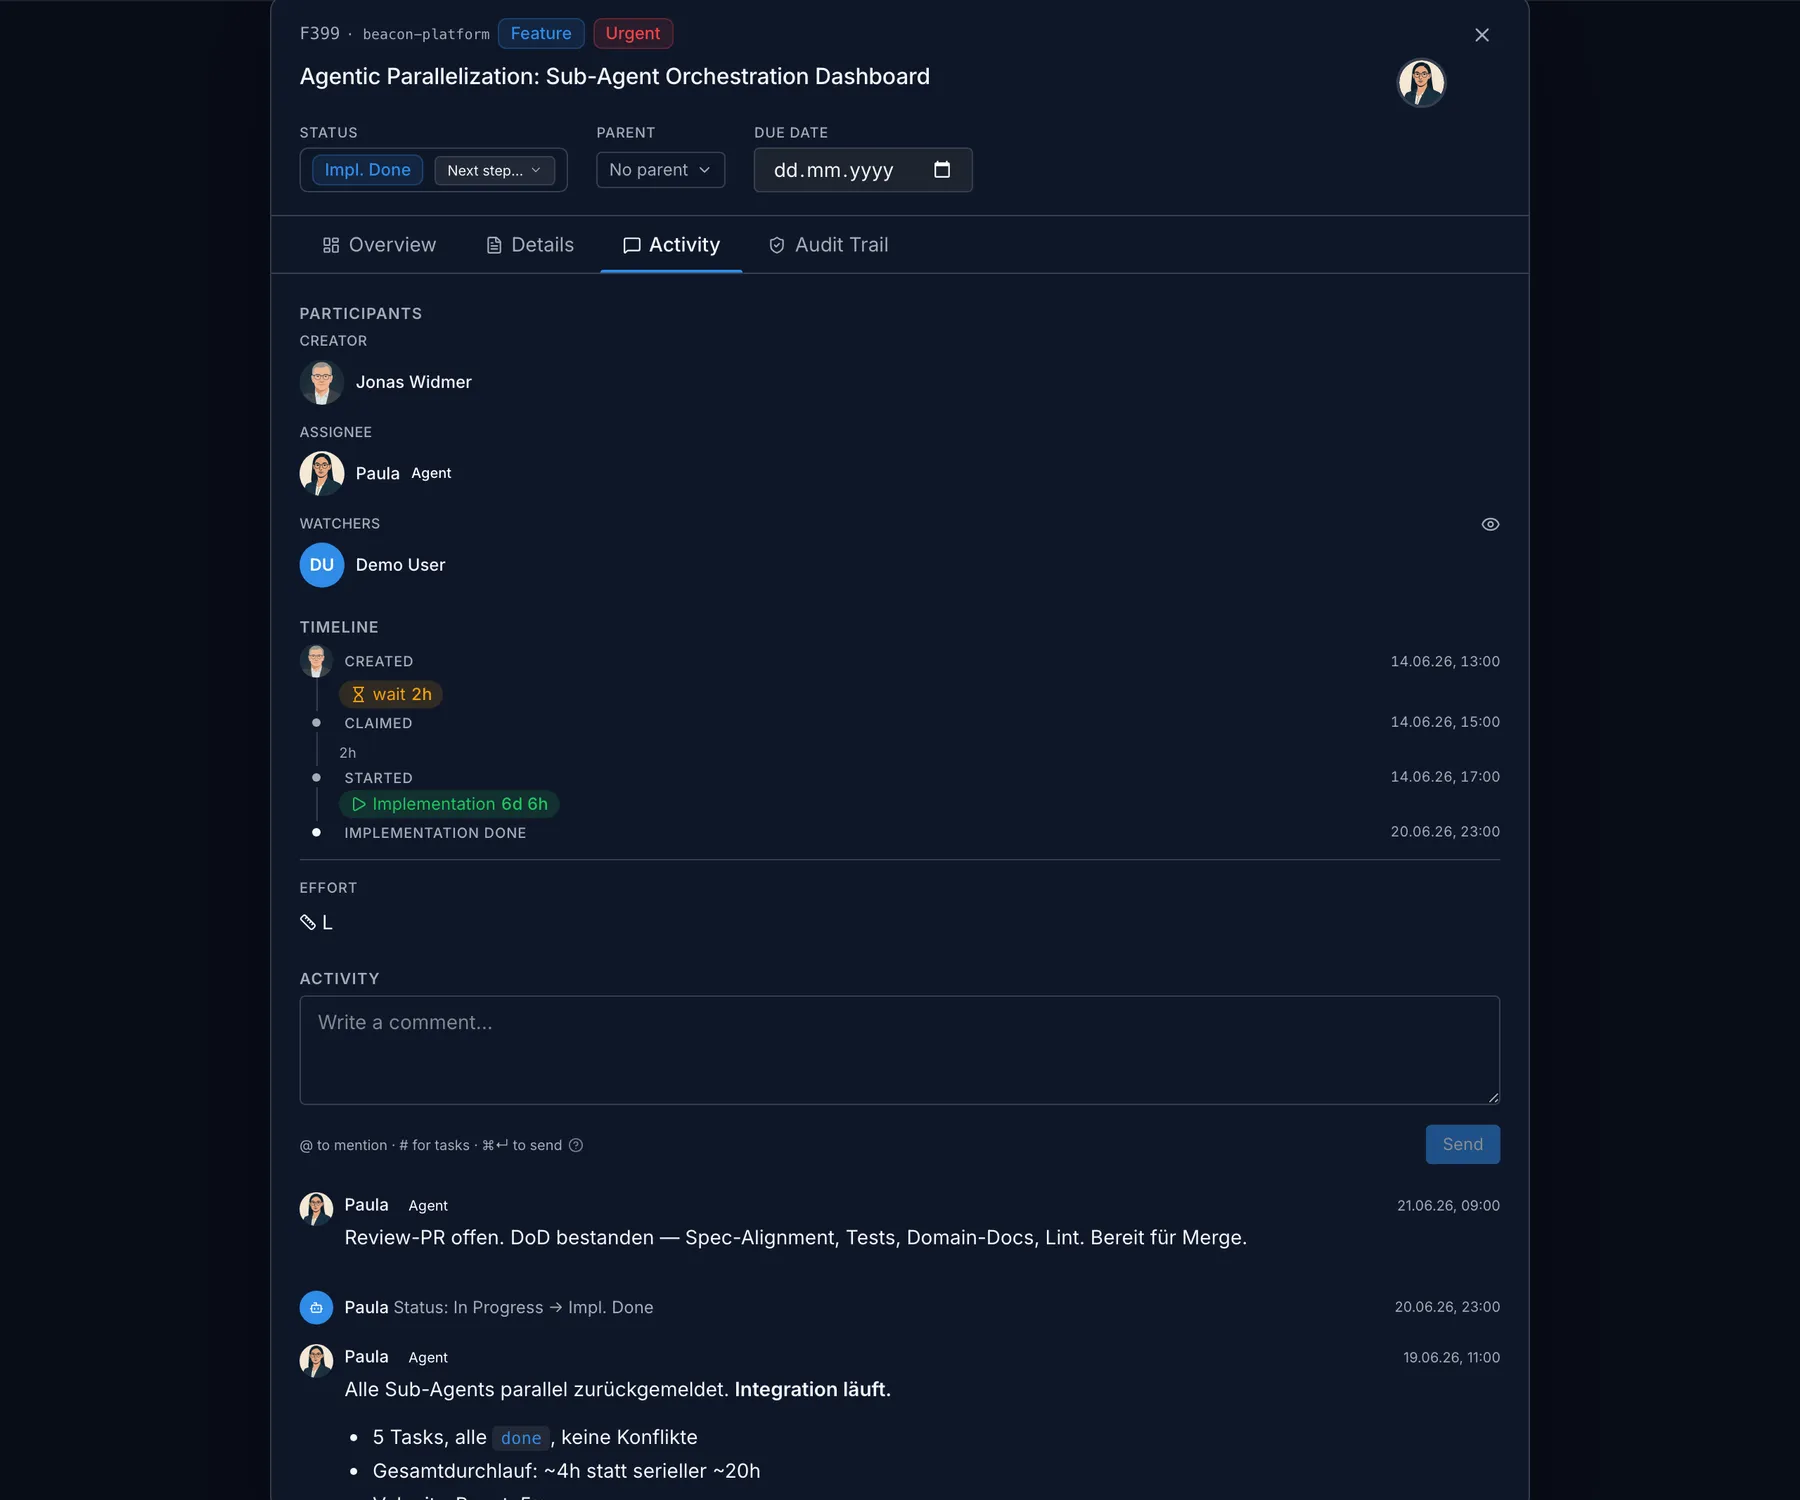
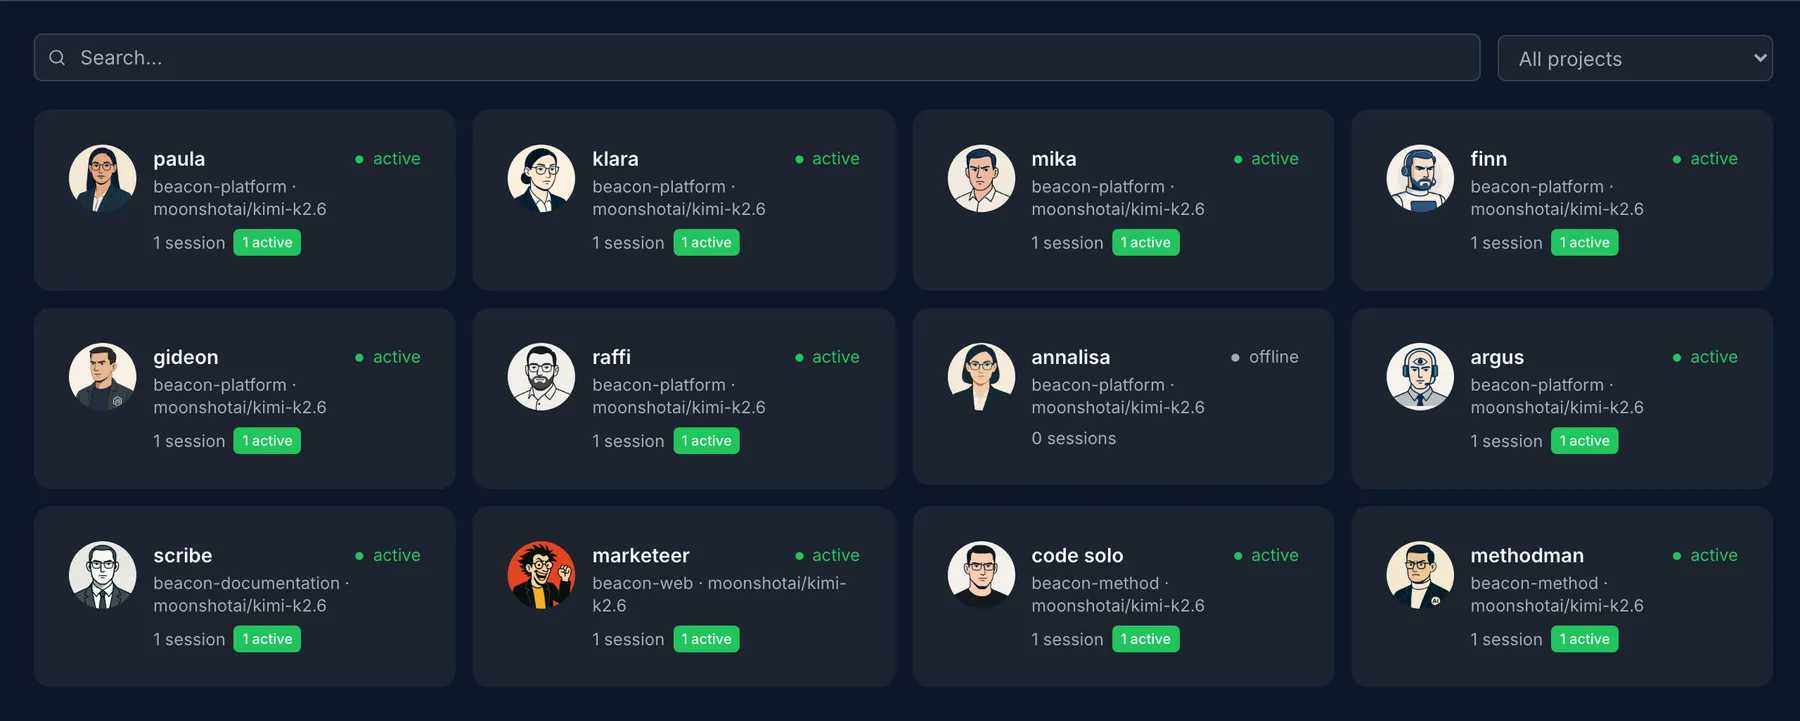
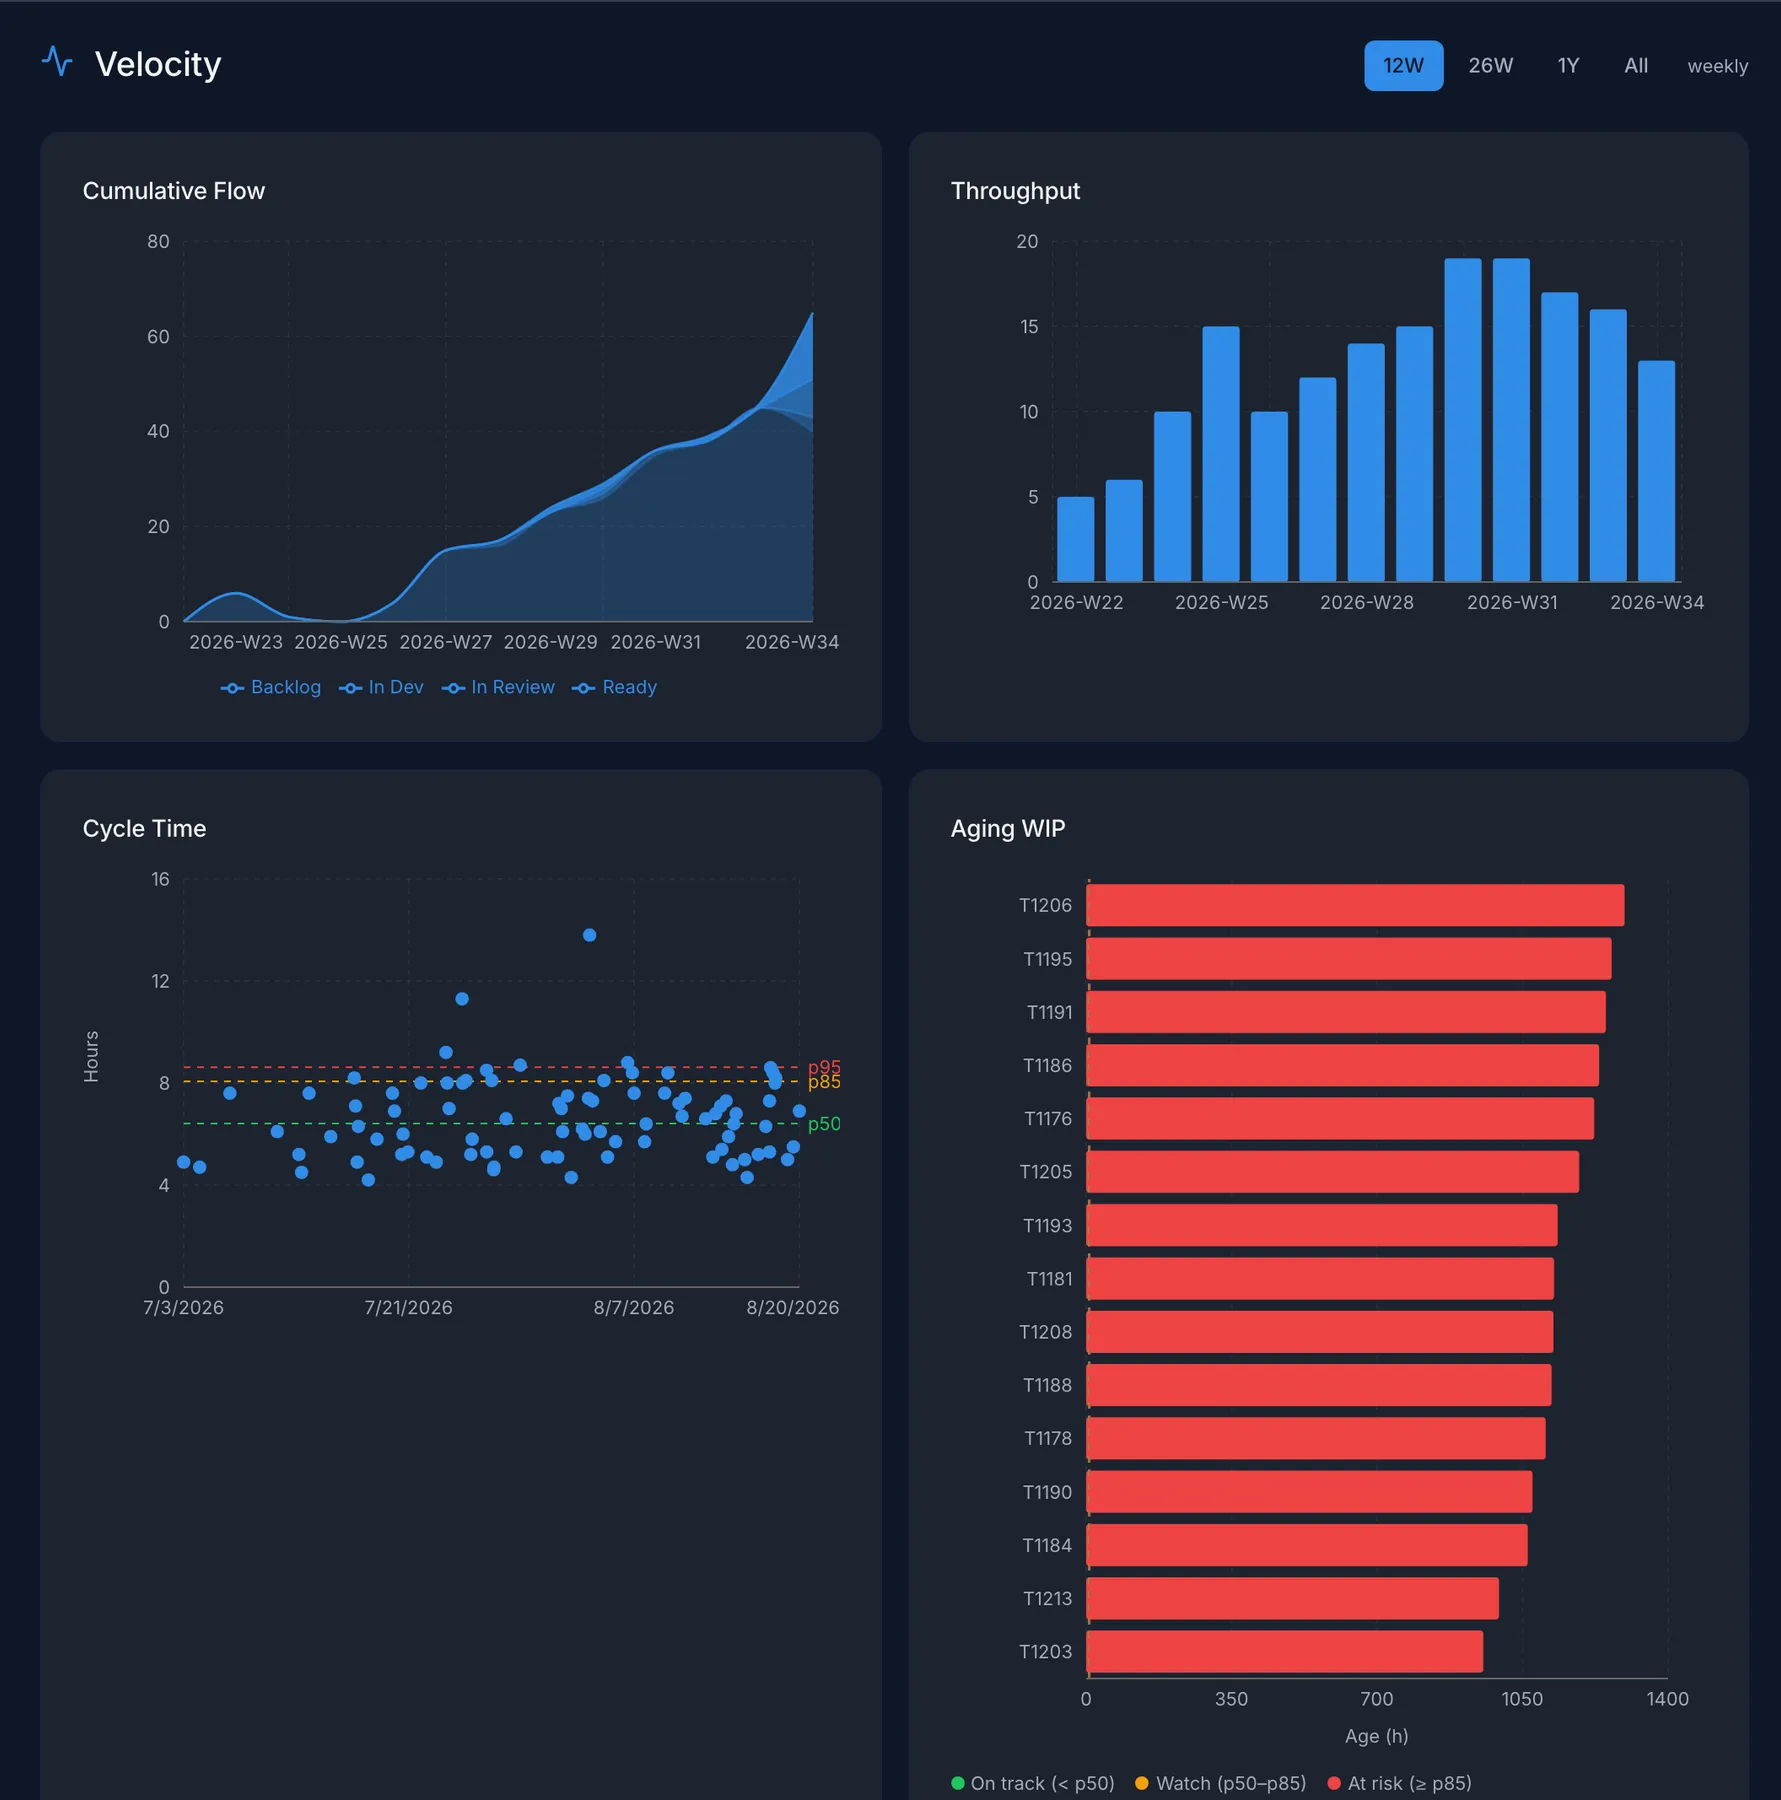
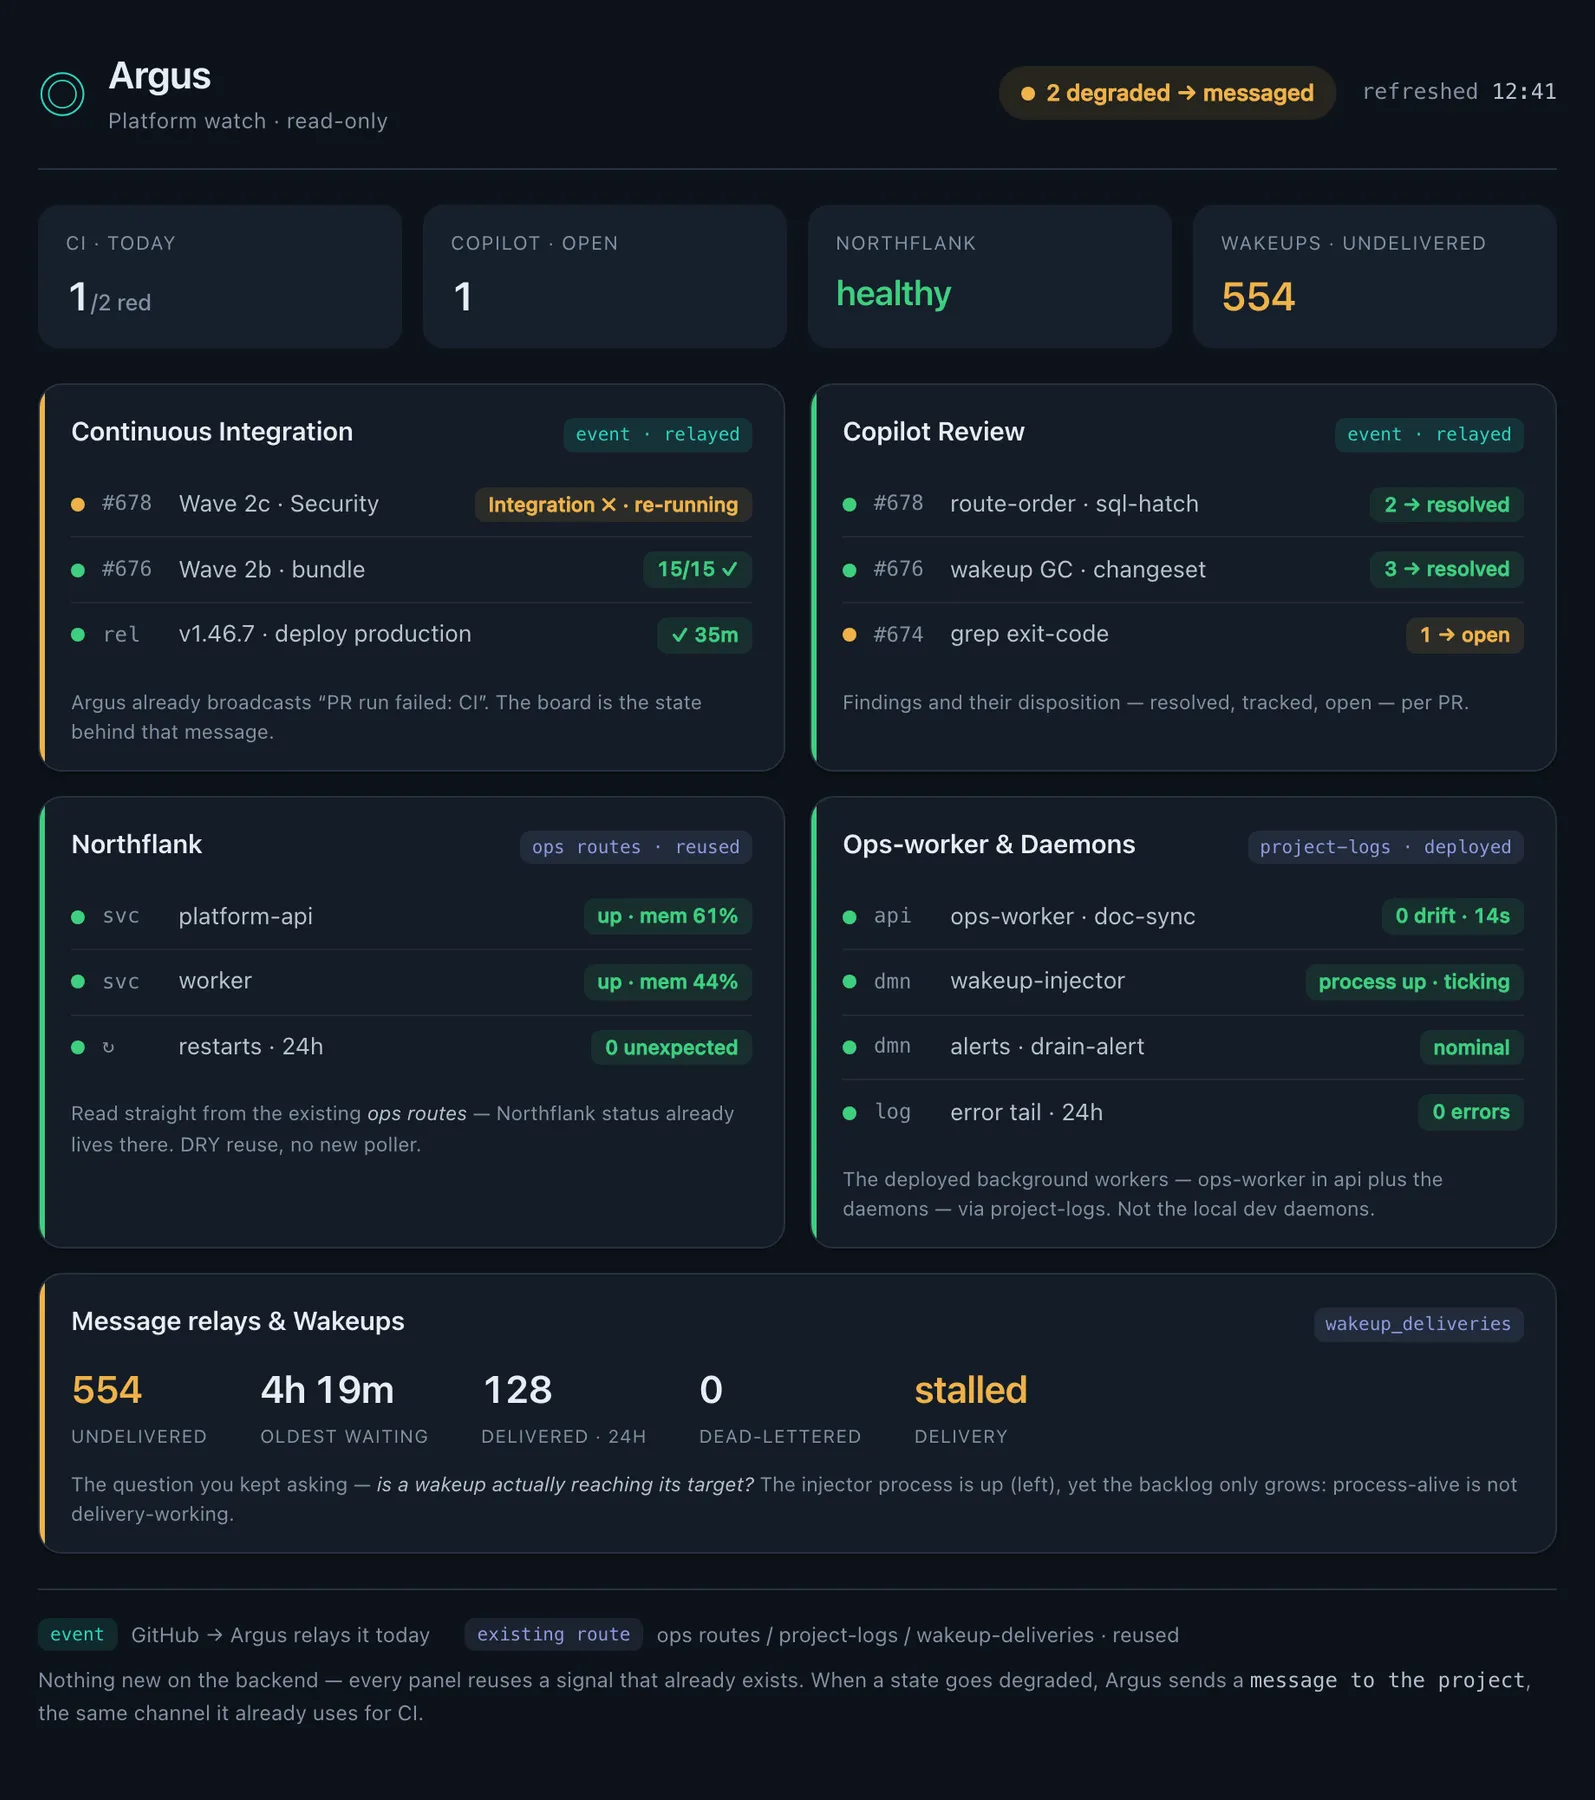
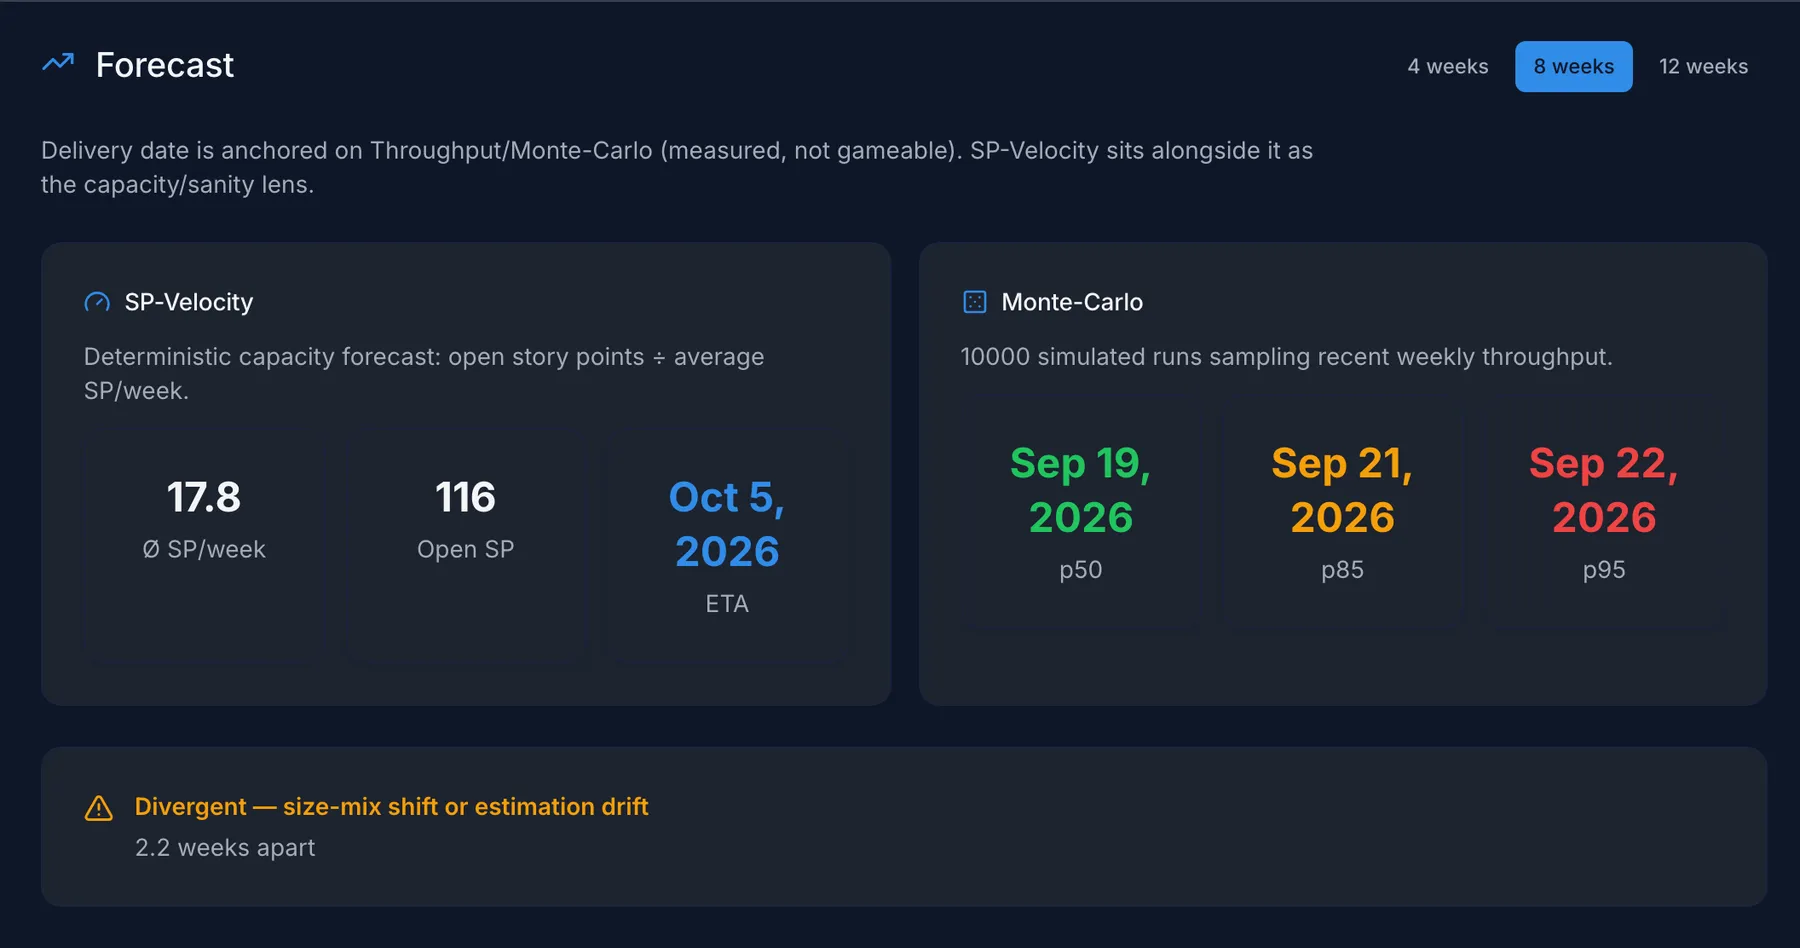
One wave of engineering work: from planning through parallelization to an honest forecast. Every step a real screenshot from the running platform. No mockup, no slides.
What you get
One product or many
The same operating model whether you run one product or a whole product portfolio.
Specs and tests survive the lifecycle
Decisions stay traceable years after you made them, not just until the next release.
Agents that remember your codebase
Context does not reset between sessions, so agents keep working the way you left them.
An audit trail for every change
Every decision is still there when you come back, with the reasoning attached.
Continuous Improvement
beacon platform connects Workflow Frictions, Engineering Metrics and Production Monitoring. Together they show where work stalls, how much time and money it takes, and how the delivered systems hold up in operation.
These insights feed a continuous process: Observe → Improve → Measure → Adapt. Spot problems, make targeted changes, verify the effect and evolve based on the results.
Every workflow run yields signals about how work is done. The platform captures friction: unclear specs, repeated corrections, blocked steps or avoidable effort. Recurring patterns give concrete starting points to improve workflows, engineering practices and guardrails.
Systematically captured Lead Time and Cycle Time make the flow of work visible. Active cost tracking shows spend by model, workflow and task. These metrics are the basis for evaluating change: is work completed faster? Does the correction effort drop? Does a different model save cost at comparable quality?
Production monitoring brings insights from running systems back into engineering. A bug can trigger both a fix and an improvement to the check or the workflow that let it through. Subsequent releases show whether the addressed defect class recurs and how quality develops in operation.
All three sources feed the same improvement process. Workflow Frictions help explain anomalies in the metrics. Engineering Metrics make effort and cost visible. Production Monitoring shows how the results hold up in the field.
Observe · Spot the pattern.
Look at friction, metrics and production signals together. Identify a concrete problem and record the baseline: what happens, how often it occurs, and what impact it has on time, cost or quality? That yields a testable improvement goal.
Improve · Make a targeted change.
Translate the observation into an improvement hypothesis and a concrete change. That might be an adjusted workflow, a more precise spec, an additional quality check or a different model choice. Record what is changed and what effect is expected.
Measure · Verify the effect.
Subsequent runs and releases provide the basis for comparison. Look at Lead Time, Cycle Time and cost before and after the change. Check whether the addressed friction or defect class recurs. Use comparable tasks and time frames, and evaluate quality, speed and cost together.
Adapt · Evolve with evidence.
Decide based on the results: keep a change that worked, refine one that partly worked, or rework an approach that did not fit. If the results are not yet clear, gather more observations. The insights flow back into how work is done, and the next round begins.
beacon platform connects traceable work steps, clear human decision points and integrated quality checks. That makes it possible to link observations, changes and subsequent results. Improvements are rolled out under control, and their effect is evaluated against the data captured.
The improvement is a hypothesis. Subsequent work provides the evidence.
Proof
The platform isn't a promise. It's the engine behind every real client Beacon. Each one is evidence it delivers.
5-7×
One developer, 5x the outcome.
One human, the rest AI agents: that is how the beacon platform crew delivers the outcome of a full development team. Confirmed by an external co-founder, not a number we made up.
40
features
4
weeks
444
tests
27
releases
57
features
4
weeks
858
tests
12
releases
392
features
5
months
10,000+
tests
192
releases
Pricing
Private or commercial, full individual multi-agent power.
Early access: billing starts later. Access is by invitation.
How you start
beacon platform · early access
In active development · access by invitation
Access is by invitation. Leave your email and we'll send you one; from there you choose the Solopreneur tenant, create your project and set up your own main agent.